What Is Intrinsic Value? Simple Explanation with Examples
22 Oct 2025
Master these essential ratios for smart stock analysis and better investment decisions

Financial ratios are like a company's vital signs - they tell you about its health, strength, and potential. Just as a doctor checks blood pressure and heart rate to assess your health, investors use financial ratios to evaluate companies.
These ratios transform complex financial statements into simple, comparable numbers that help you:
Spot well-managed businesses with strong fundamentals and competitive advantages.
Recognize companies that look cheap but have underlying problems.
Evaluate businesses within the same industry on an apples-to-apples basis.
Base your investments on data rather than emotions or tips.
Warren Buffett once said: "It's far better to buy a wonderful company at a fair price than a fair company at a wonderful price." Financial ratios help you identify those "wonderful companies" and determine what constitutes a "fair price."
Financial ratios are typically grouped into four main categories, each telling you something different about the company:
| Category | What It Measures | Key Ratios |
|---|---|---|
| Profitability Ratios | How efficiently the company generates profits | ROE, ROCE, Profit Margins |
| Valuation Ratios | Whether the stock is fairly priced | PE Ratio, PB Ratio, PEG Ratio |
| Leverage Ratios | How much debt the company uses | Debt-to-Equity, Interest Coverage |
| Liquidity Ratios | Ability to meet short-term obligations | Current Ratio, Quick Ratio |
P/E Ratio = Current Stock Price ÷ Earnings Per Share (EPS)
The P/E ratio is probably the most famous financial ratio. It tells you how much investors are willing to pay for each rupee of a company's earnings.
Real-world Interpretation: A P/E of 20 means investors are paying ₹20 for every ₹1 of annual earnings. Lower P/E may indicate undervaluation (or problems), while very high P/E may suggest overvaluation or high growth expectations.
P/E ratios can be misleading for companies with volatile earnings, one-time gains/losses, or different accounting methods. Always compare with industry peers and consider growth prospects.
ROE = (Net Income ÷ Shareholders' Equity) × 100
ROE measures how efficiently a company uses shareholders' money to generate profits. It's like checking the return on your investment in the business.
Real-world Interpretation: An ROE of 20% means for every ₹100 of shareholder money invested, the company generates ₹20 in annual profit. Consistently high ROE often indicates a company with competitive advantages.
Pro Tip: Look for companies with ROE consistently above 15% for 5+ years. Also check if high ROE comes from genuine business performance rather than excessive debt.
Debt-to-Equity = Total Debt ÷ Shareholders' Equity
This ratio shows how much debt a company uses compared to its equity. It helps you understand the company's financial risk and stability.
Real-world Interpretation: A ratio of 0.6 means for every ₹1 of equity, the company has ₹0.6 of debt. Lower ratios generally indicate less financial risk. Capital-intensive industries may have higher acceptable ratios.
Very low debt isn't always good - it might mean the company isn't leveraging opportunities. Very high debt increases bankruptcy risk, especially during economic downturns.
Current Ratio = Current Assets ÷ Current Liabilities
The current ratio measures a company's ability to pay its short-term obligations with its short-term assets. It's a key indicator of financial health.
Real-world Interpretation: A current ratio of 1.33 means the company has ₹1.33 in current assets for every ₹1 of short-term debts. Ratios below 1 indicate potential liquidity problems, while very high ratios may suggest inefficient use of assets.
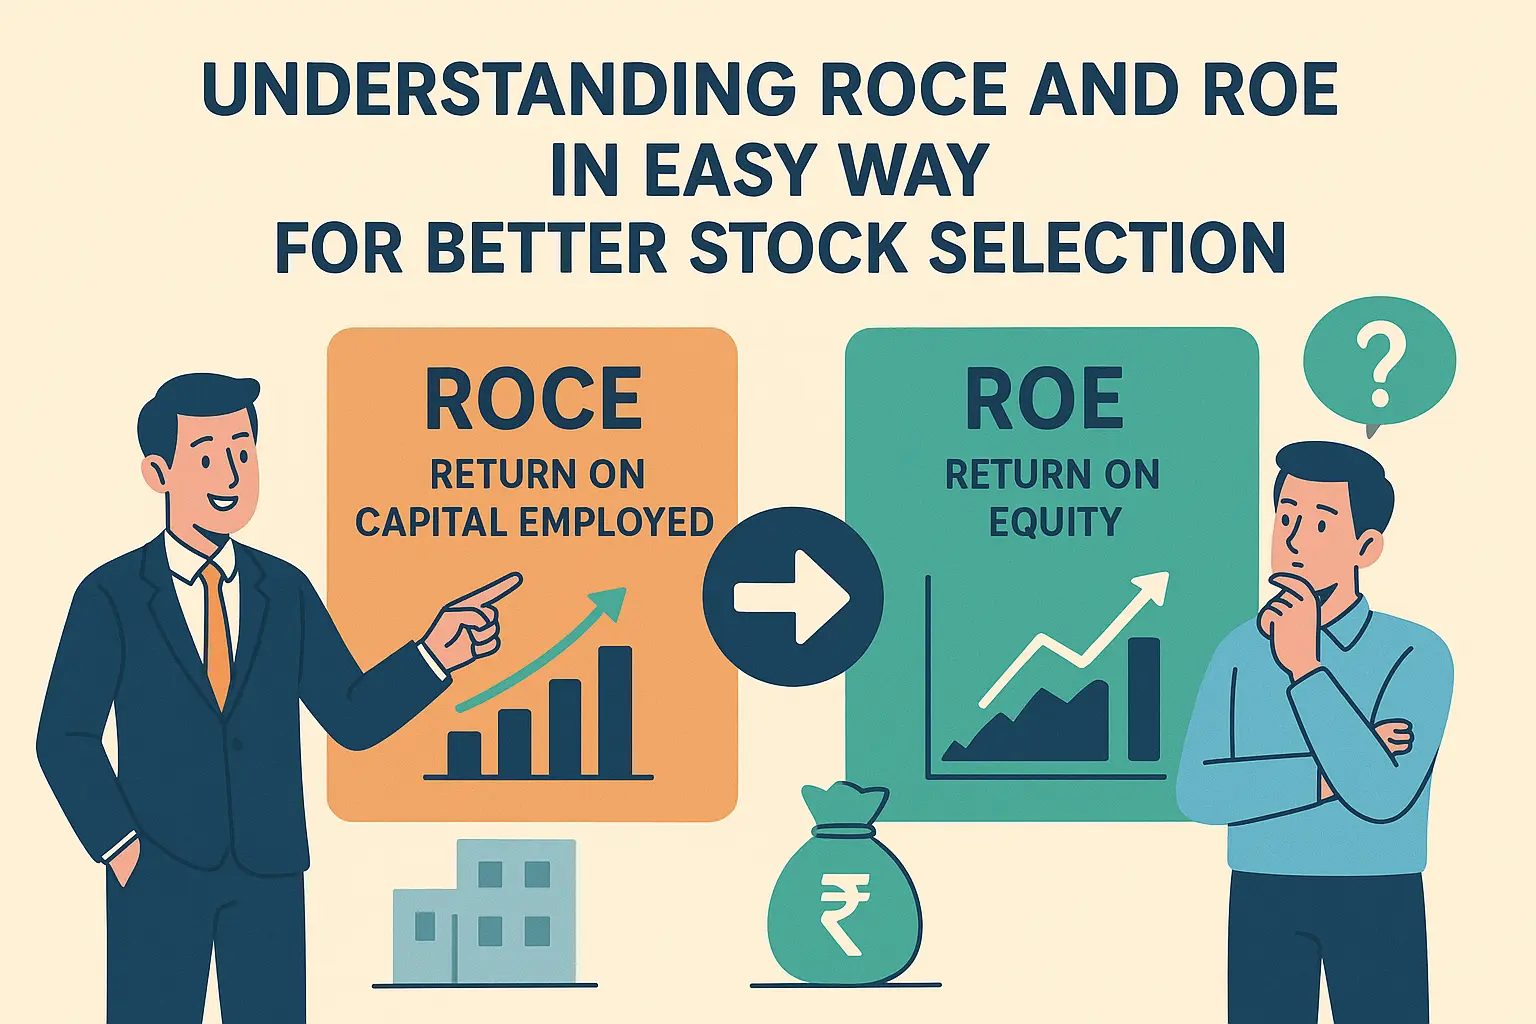
ROCE = (EBIT ÷ Capital Employed) × 100
Where Capital Employed = Total Assets - Current Liabilities
ROCE measures how efficiently a company uses all its capital (both equity and debt) to generate profits. Many experts consider it superior to ROE because it considers total capital.
Real-world Interpretation: An ROCE of 18.75% means the company generates ₹18.75 in operating profit for every ₹100 of capital employed. Companies with consistently high ROCE typically have strong competitive advantages.
ROCE considers both equity and debt, giving a complete picture of capital efficiency. ROE only considers equity. ROCE is better for comparing companies with different debt levels.
P/B Ratio = Market Price Per Share ÷ Book Value Per Share
The P/B ratio compares a company's market value to its book value (assets minus liabilities). It's particularly useful for asset-heavy businesses.
Real-world Interpretation: A P/B of 1.33 means investors are paying ₹1.33 for every ₹1 of net assets. P/B below 1 might indicate undervaluation (or serious problems). For service companies, P/B is less relevant.
Gross Margin = (Gross Profit ÷ Revenue) × 100
This ratio shows what percentage of revenue remains after deducting the direct costs of producing goods or services. It measures production efficiency and pricing power.
Real-world Interpretation: A gross margin of 30% means for every ₹100 in sales, the company keeps ₹30 after direct production costs. Rising gross margins often indicate improving efficiency or stronger pricing power.
Dividend Yield = (Annual Dividend Per Share ÷ Stock Price) × 100
Dividend yield shows the percentage return you get from dividends relative to the stock price. It's important for income-focused investors.
Real-world Interpretation: A 5% dividend yield means you earn ₹5 annually for every ₹100 invested. Very high yields (>8%) may be unsustainable. Growing companies often have low yields as they reinvest profits.
PEG Ratio = P/E Ratio ÷ Earnings Growth Rate
The PEG ratio improves on the P/E ratio by considering growth. It helps you determine if a stock's valuation is reasonable given its growth prospects.
Real-world Interpretation: A PEG of 1.25 suggests the stock might be slightly overvalued relative to its growth. PEG below 1 often indicates potential undervaluation. Use 3-5 year expected growth rates for calculation.
Interest Coverage = EBIT ÷ Interest Expense
This ratio measures how easily a company can pay interest on its outstanding debt. It's a crucial indicator of financial safety.
Real-world Interpretation: An interest coverage of 5 means the company's operating profit is 5 times its interest expense. Ratios below 1.5 indicate danger - the company may struggle to pay interest during downturns.
| Ratio | Excellent | Good | Caution | Poor |
|---|---|---|---|---|
| P/E Ratio | 10-15 | 15-25 | 25-35 | 35+ |
| ROE | 20%+ | 15-20% | 10-15% | Below 10% |
| Debt-to-Equity | Below 0.5 | 0.5-1.0 | 1.0-2.0 | Above 2.0 |
| Current Ratio | 1.5-2.0 | 1.2-1.5 | 1.0-1.2 | Below 1.0 |
| ROCE | 20%+ | 15-20% | 10-15% | Below 10% |
| Interest Coverage | 5+ | 3-5 | 1.5-3 | Below 1.5 |
Important: These benchmarks are general guidelines. Always compare ratios with industry peers and consider the company's specific circumstances, growth stage, and economic environment.
Use ratios to filter potential investments. For example, screen for companies with ROE > 15%, Debt/Equity < 1, and P/E < 25.
For shortlisted companies, calculate all 10 ratios and analyze trends over 5+ years.
Compare ratios with 3-4 direct competitors to understand relative performance.
Consider industry norms, economic cycle, and company-specific factors.
Financial ratios are powerful tools that can significantly improve your investment decisions. However, they're not magic formulas - they're starting points for deeper analysis.
Remember these key principles:
Mastering these 10 financial ratios will give you a significant edge in identifying quality companies, avoiding value traps, and making more informed investment decisions. With practice, you'll be able to quickly assess a company's financial health and make better investment choices.
Next Steps: Start applying these ratios to companies you're interested in. Create a simple spreadsheet to track key ratios for your watchlist. Remember that ratio analysis improves with practice - the more companies you analyze, the better your intuition will become.
This article is for educational purposes only and does not constitute investment advice. Financial ratios should be used as tools for analysis, not as sole decision-makers. Always do your own research and consider consulting with a qualified financial advisor before making investment decisions. Past performance is not indicative of future results.