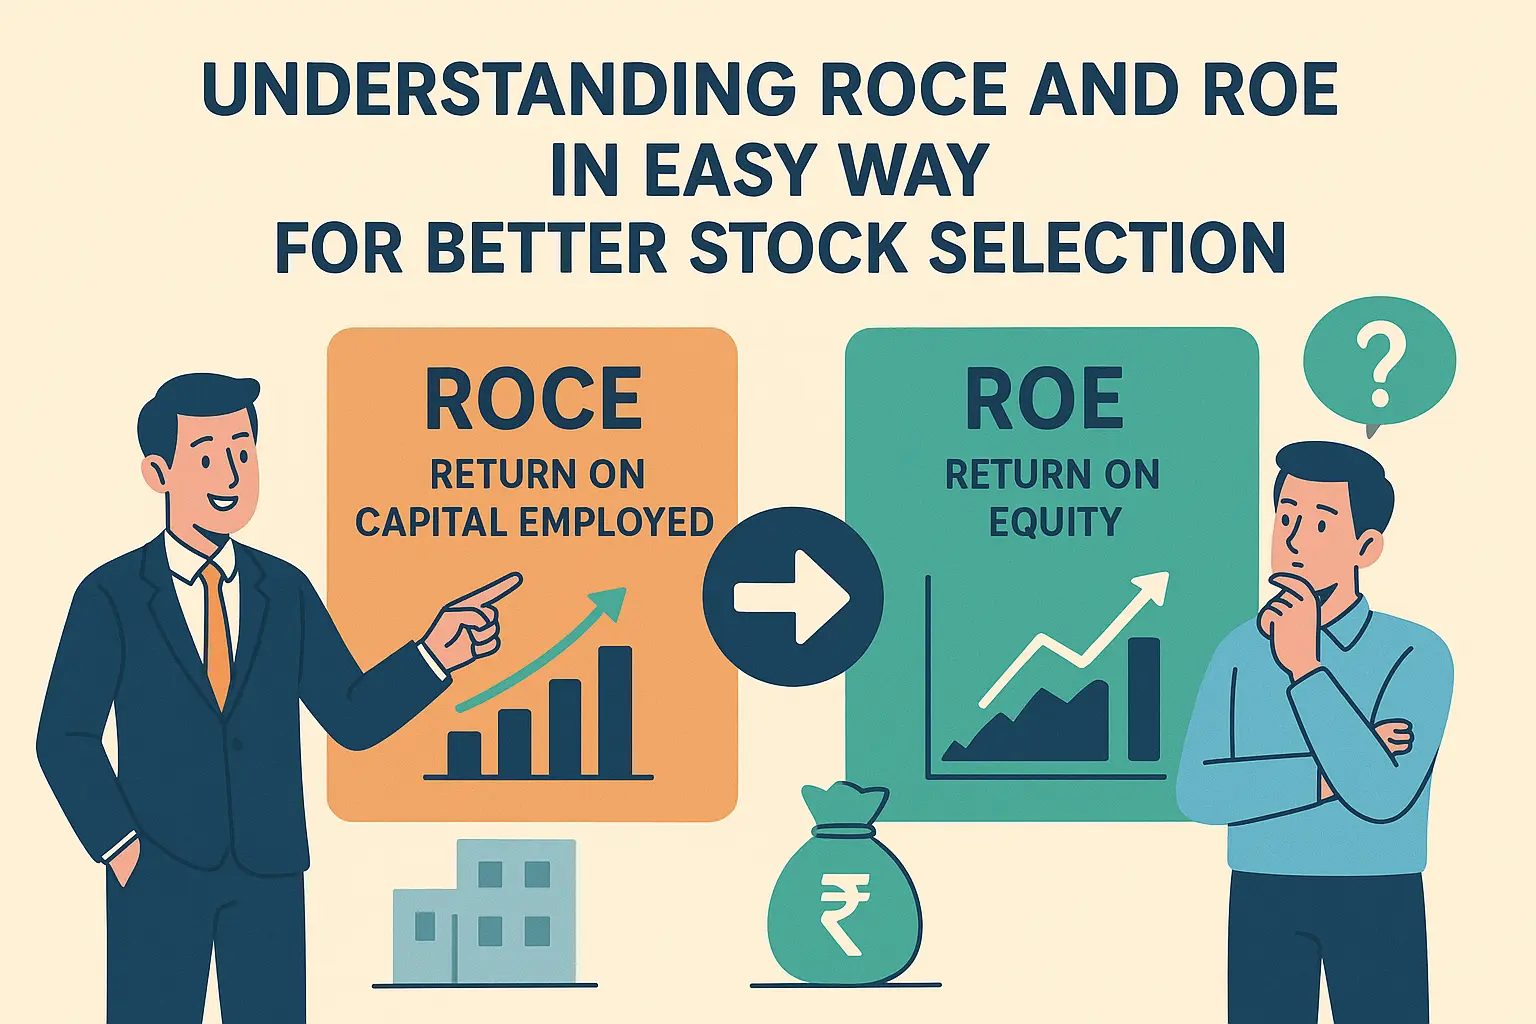

What Exactly Are ROCE and ROE?
When you're investing in stocks, you need tools to separate the truly great companies from the merely good ones. Two of the most powerful tools in your investing toolkit should be ROCE and ROE.
ROCE (Return on Capital Employed) measures how efficiently a company is using its capital to generate profits. Think of it as answering the question: "For every rupee the company has invested in its business, how much profit is it making?"
ROE (Return on Equity) measures how effectively a company is using shareholders' money to generate profits. It answers: "For every rupee of shareholder money invested, how much profit is the company creating?"
Both metrics are expressed as percentages, and generally, higher percentages indicate better performance.
The Simple Math Behind These Ratios
Let's look at the formulas without getting too technical:
ROCE = (EBIT / Capital Employed) × 100
Where:
- EBIT = Earnings Before Interest and Taxes
- Capital Employed = Total Assets - Current Liabilities
ROE = (Net Income / Shareholders' Equity) × 100
Where:
- Net Income = Profit after all expenses and taxes
- Shareholders' Equity = Total Assets - Total Liabilities
Simple Analogy: Think of ROCE as measuring how well a restaurant uses its kitchen equipment and space to generate profits, while ROE measures how well it uses the owner's investment to create returns.
Real-World Examples to Understand Better
Example 1: Company A vs Company B
Let's compare two fictional companies in the same industry:
| Metric | Company A | Company B | What It Means |
|---|---|---|---|
| ROCE | 18% | 9% | Company A uses capital twice as efficiently |
| ROE | 22% | 14% | Company A generates better returns for shareholders |
| Debt Level | Low | High | Company B's ROE might be artificially inflated by debt |
In this case, Company A is clearly the better investment choice based on both ROCE and ROE.
Example 2: The Restaurant Business
Imagine two restaurants:
Restaurant X: Invested ₹50 lakhs in kitchen equipment, decor, and location. Makes ₹10 lakhs annual profit.
ROCE Calculation: (10/50) × 100 = 20% ROCE
Restaurant Y: Same ₹50 lakhs investment, but makes only ₹6 lakhs profit.
ROCE Calculation: (6/50) × 100 = 12% ROCE
Restaurant X is clearly using its capital more efficiently!
Why These Ratios Matter for Stock Selection
Companies with consistently high ROCE and ROE are typically well-managed with competitive advantages.
While absolute numbers vary by industry, these ratios help you compare companies within the same sector.
Declining ROCE/ROE can signal deteriorating business fundamentals before they show up in stock price.
Companies funding growth from profits (high ROE) tend to be more sustainable than those relying on debt.
ROCE vs ROE: Key Differences and When to Use Each
| Aspect | ROCE | ROE |
|---|---|---|
| Focus | Overall capital efficiency | Shareholder returns |
| Capital Considered | Both equity and debt | Only equity |
| Best For | Capital-intensive businesses | Comparing shareholder returns |
| Debt Impact | Gives clearer picture with debt | Can be inflated by high debt |
| Ideal Range | 15%+ generally good | 15%+ generally good |
💡 Professional Investor Insight
Many professional investors look for companies with ROCE consistently above 15% and ROE consistently above 15-20%. The key word is consistently - one year of high returns might be a fluke, but several years indicate genuine business quality.
How to Use ROCE and ROE in Your Investment Process
Step 1: Industry Benchmarking
First, understand what good looks like in that industry. Capital-intensive sectors like manufacturing might have lower ROCE standards than software companies.
Industry Examples:
- IT Services: Good ROCE = 20%+, Good ROE = 18%+
- Manufacturing: Good ROCE = 15%+, Good ROE = 15%+
- Banking: Different metrics apply due to leverage
Step 2: Trend Analysis
Look at 5-10 years of data. Is the company improving, maintaining, or deteriorating?
Good Pattern: 18% → 19% → 20% → 21% → 22% (Consistent improvement)
Warning Sign: 25% → 22% → 18% → 15% → 12% (Consistent decline)
Step 3: Peer Comparison
Compare with 3-4 direct competitors. A company might have 16% ROCE which seems good, but if competitors average 22%, it's actually underperforming.
Step 4: Debt Check
If ROE is much higher than ROCE, check if it's because of high debt levels that could be risky.
⚠️ Important Warning About ROE
High ROE can sometimes be a red flag if it's driven by excessive debt rather than genuine business performance. Always check the debt-to-equity ratio alongside ROE.
Case Study: Applying ROCE and ROE to Real Stocks
Let's look at how these ratios work in practice (using hypothetical but realistic numbers):
| Company | Industry | ROCE (5-yr avg) | ROE (5-yr avg) | Debt/Equity | Assessment |
|---|---|---|---|---|---|
| Quality Ltd. | Consumer Goods | 24% | 26% | 0.3 | Excellent - efficient with low debt |
| Steady Corp. | Manufacturing | 16% | 18% | 0.5 | Good - solid performer |
| Risky Inc. | Infrastructure | 9% | 22% | 2.1 | Avoid - high ROE from dangerous debt levels |
| Weak Co. | Textiles | 8% | 10% | 0.8 | Poor - inefficient capital use |
Common Mistakes to Avoid
Putting It All Together: Your Stock Selection Checklist
✅ Your ROCE/ROE Checklist
- ROCE consistently above 15% for past 5 years
- ROE consistently above 15% for past 5 years
- Stable or improving trend in both ratios
- Better than industry and competitor averages
- ROE not significantly higher than ROCE (unless justified by business model)
- Reasonable debt levels (debt-to-equity under 1 for most businesses)
Remember: ROCE and ROE are powerful tools, but they're not the only ones you need. Use them alongside other metrics like P/E ratio, debt levels, management quality, and business moats for comprehensive stock analysis.
Final Thoughts
Understanding ROCE and ROE can significantly improve your stock selection process. These ratios help you identify companies that are truly creating value rather than just growing in size. Remember the key principles:
- Look for consistent high returns, not one-year wonders
- Always compare with industry peers
- Check both ROCE and ROE together
- Be wary of high ROE driven by excessive debt
- Focus on business quality first, valuation second
By making ROCE and ROE analysis a regular part of your investment research, you'll be better equipped to find the quality companies that can deliver sustainable long-term returns.
Other Financial Articles

