
What is a Balance Sheet and Why Should You Care?
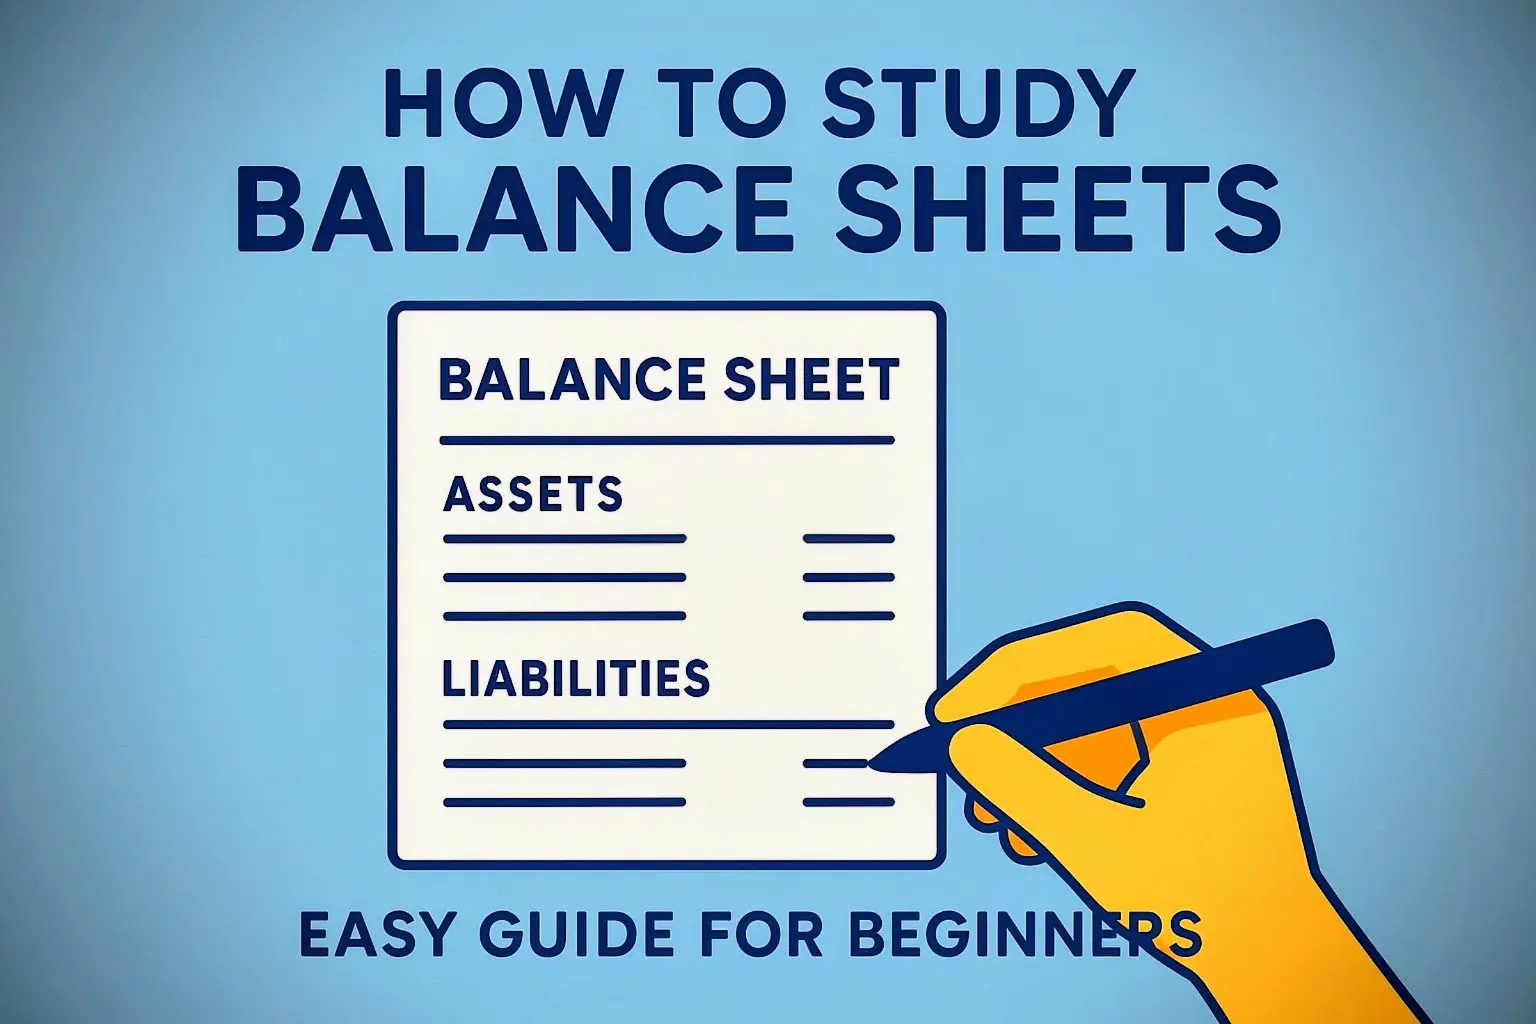
If you're investing in stocks or planning to, understanding a company's balance sheet is one of the most important skills you can develop. Think of a balance sheet as a company's financial health report card at a specific point in time.
A balance sheet shows you three crucial things:
- What the company owns (Assets)
- What the company owes (Liabilities)
- What belongs to the owners (Shareholders' Equity)
The beauty of a balance sheet lies in its simplicity - it always follows this fundamental rule:
Assets = Liabilities + Shareholders' Equity
This equation must always balance, which is why it's called a "balance sheet." If it doesn't balance, there's an error in the accounting!
The Three Main Components Explained Simply
Assets are resources that have economic value and can generate future benefits. They're divided into two main categories:
Current Assets
These are assets that can be converted to cash within one year:
- Cash & Cash Equivalents: Money in bank accounts, short-term investments
- Accounts Receivable: Money owed to the company by customers
- Inventory: Goods ready for sale or in production
- Prepaid Expenses: Payments made in advance for future services
Non-Current Assets (Fixed Assets)
These are long-term assets that provide value for more than one year:
- Property, Plant & Equipment (PP&E): Land, buildings, machinery, vehicles
- Intangible Assets: Patents, trademarks, copyrights, goodwill
- Long-term Investments: Stocks, bonds, or other companies owned long-term
Liabilities represent the company's obligations to outsiders. Like assets, they're divided into two categories:
Current Liabilities
Debts and obligations due within one year:
- Accounts Payable: Money owed to suppliers
- Short-term Debt: Loans due within one year
- Accrued Expenses: Expenses incurred but not yet paid
- Unearned Revenue: Payments received for services not yet provided
Non-Current Liabilities (Long-term Liabilities)
Obligations due after more than one year:
- Long-term Debt: Bank loans, bonds payable after one year
- Deferred Tax Liabilities: Taxes that will be paid in future years
- Pension Obligations: Future payments to retired employees
This represents the owners' claim on the company's assets after all liabilities are paid. It includes:
- Share Capital: Money raised by issuing shares
- Retained Earnings: Cumulative profits reinvested in the business
- Reserves: Various types of reserves created from profits
Simple Analogy: If you buy a house worth ₹50 lakhs with a ₹30 lakhs home loan, your personal "balance sheet" would be:
Assets: House ₹50 lakhs
Liabilities: Home loan ₹30 lakhs
Equity: Your investment ₹20 lakhs
Assets (50) = Liabilities (30) + Equity (20)
Sample Balance Sheet: Understanding with Example
Let's look at a simplified balance sheet for "ABC Manufacturing Company" as of March 31, 2025:
| ABC Manufacturing Company | |
|---|---|
| Balance Sheet as of March 31, 2025 (Amounts in ₹ Lakhs) | |
| ASSETS | |
| Current Assets | |
| Cash and Cash Equivalents | 150 |
| Accounts Receivable | 300 |
| Inventory | 400 |
| Prepaid Expenses | 50 |
| Total Current Assets | 900 |
| Non-Current Assets | |
| Property, Plant & Equipment | 1,200 |
| Intangible Assets | 100 |
| Total Non-Current Assets | 1,300 |
| TOTAL ASSETS | 2,200 |
| LIABILITIES AND EQUITY | |
| Current Liabilities | |
| Accounts Payable | 250 |
| Short-term Debt | 150 |
| Accrued Expenses | 100 |
| Total Current Liabilities | 500 |
| Non-Current Liabilities | |
| Long-term Debt | 600 |
| Total Non-Current Liabilities | 600 |
| TOTAL LIABILITIES | 1,100 |
| Shareholders' Equity | |
| Share Capital | 500 |
| Retained Earnings | 600 |
| Total Shareholders' Equity | 1,100 |
| TOTAL LIABILITIES AND EQUITY | 2,200 |
Notice how Total Assets (2,200) = Total Liabilities + Equity (1,100 + 1,100)? That's the balance sheet in action!
5 Key Balance Sheet Ratios Every Beginner Should Know
Numbers alone don't tell the full story. Ratios help you understand the relationships between different balance sheet items. Here are the most important ones:
Formula: Current Assets ÷ Current Liabilities
What it tells you: Company's ability to pay short-term obligations
Good range: 1.5 to 3.0 (varies by industry)
ABC Company: 900 ÷ 500 = 1.8 (Healthy)
Formula: Total Debt ÷ Shareholders' Equity
What it tells you: How much debt vs. equity funds the company
Good range: Below 1.0 (varies by industry)
ABC Company: (150+600) ÷ 1,100 = 0.68 (Good)
Formula: (Current Assets - Inventory) ÷ Current Liabilities
What it tells you: Immediate liquidity without selling inventory
Good range: Above 1.0
ABC Company: (900-400) ÷ 500 = 1.0 (Adequate)
Formula: Total Debt ÷ Total Assets
What it tells you: What percentage of assets is financed by debt
Good range: Below 0.5 (50%)
ABC Company: 750 ÷ 2,200 = 0.34 (34% - Good)
Step-by-Step Guide to Analyzing Any Balance Sheet
Step 1: Check the Big Picture First
Start by looking at the totals:
- Are total assets growing over time? (Good sign)
- Is debt growing faster than equity? (Potential red flag)
- Are retained earnings increasing? (Shows profitability)
Step 2: Analyze Asset Quality
Look at the composition of assets:
- What percentage is current vs. fixed assets?
- Is there too much inventory? (Might indicate slow sales)
- Are accounts receivable growing faster than sales? (Could mean collection issues)
Step 3: Examine Liability Structure
Understand the debt profile:
- What's the proportion of short-term vs. long-term debt?
- Is the company heavily reliant on debt financing?
- Are current liabilities manageable compared to current assets?
Step 4: Calculate Key Ratios
Compute the ratios we discussed earlier and compare them to:
- Industry averages
- The company's own historical ratios
- Direct competitors' ratios
Step 5: Look for Red Flags
Watch out for these warning signs:
- Consistently negative retained earnings
- Rising debt while profits are stagnant or falling
- Current ratio below 1.0
- Sudden large increases in intangible assets (could be overpaying for acquisitions)
💡 Professional Analyst Tip
Always look at multiple years of balance sheets (at least 3-5 years) to identify trends. One year's data can be misleading, but trends don't lie. Also compare balance sheet analysis with income statement and cash flow statement analysis for a complete picture.
Real Company Example: What to Look For
Let's compare two fictional companies in the same industry:
| Metric | Healthy Co. | Risky Co. | Analysis |
|---|---|---|---|
| Current Ratio | 2.1 | 0.8 | Risky Co. may struggle to pay short-term debts |
| Debt-to-Equity | 0.5 | 2.3 | Risky Co. has very high debt levels |
| Cash % of Assets | 15% | 3% | Healthy Co. has better liquidity cushion |
| Retained Earnings Trend | Consistently growing | Fluctuating/declining | Healthy Co. is consistently profitable |
Based on this simple analysis, Healthy Co. appears to be the better investment choice.
Common Balance Sheet Mistakes to Avoid
⚠️ Common Beginner Mistakes
- Looking at only one year: Always analyze trends over multiple years
- Ignoring industry context: Different industries have different balance sheet structures
- Focusing only on totals: The composition of assets and liabilities matters
- Overlooking off-balance sheet items: Some obligations may not appear on the balance sheet
- Not reading the notes: Important details are often in the footnotes
Balance Sheet vs. Other Financial Statements
It's important to understand how the balance sheet relates to other financial statements:
| Financial Statement | What It Shows | Time Period | Key Question Answered |
|---|---|---|---|
| Balance Sheet | Financial position at a point in time | Specific date | What is the company's financial health? |
| Income Statement | Profitability over a period | Period (quarter/year) | How profitable is the company? |
| Cash Flow Statement | Cash movements over a period | Period (quarter/year) | How does cash move in and out? |
Remember: The balance sheet connects to the income statement through retained earnings (profits get added to equity), and to the cash flow statement through changes in cash balance.
Where to Find Balance Sheets
As an investor, you can easily access company balance sheets through:
Most companies have an "Investor Relations" section with annual reports and financial statements.
Websites like MoneyControl, Screener.in, Yahoo Finance, and Google Finance provide balance sheets for public companies.
In India, check BSE and NSE websites for company filings, or SEBI's database for regulatory documents.
Companies send annual reports to shareholders, which include full financial statements with detailed notes.
Your Quick Balance Sheet Analysis Checklist
✅ Balance Sheet Health Checklist
- Current ratio above 1.5 (industry dependent)
- Debt-to-equity ratio below 1.0 (industry dependent)
- Consistent growth in retained earnings
- Adequate cash reserves (5-15% of assets)
- Accounts receivable not growing faster than sales
- Inventory levels appropriate for the business
- Total assets growing steadily over time
- Equity growing faster than debt
Final Thoughts for Beginners
Learning to read and analyze balance sheets might seem daunting at first, but with practice, it becomes second nature. Remember these key takeaways:
- The balance sheet always follows: Assets = Liabilities + Equity
- Focus on trends over time rather than single data points
- Use ratios to compare companies and identify strengths/weaknesses
- Always consider the industry context when analyzing numbers
- Combine balance sheet analysis with income statement and cash flow analysis
With this knowledge, you're now equipped to start analyzing company balance sheets and making more informed investment decisions. Remember, the balance sheet tells you where a company stands financially - it's up to you to interpret what that means for its future.
Next Steps: Practice analyzing balance sheets of companies you're interested in. Start with simple businesses and gradually move to more complex ones. Compare companies within the same industry to develop your analytical skills.
Other Financial Articles


Understanding ROCE and ROE: Smart Stock Selection Guide

PE vs PEG Ratio: Which is Better for Stock Selection?
