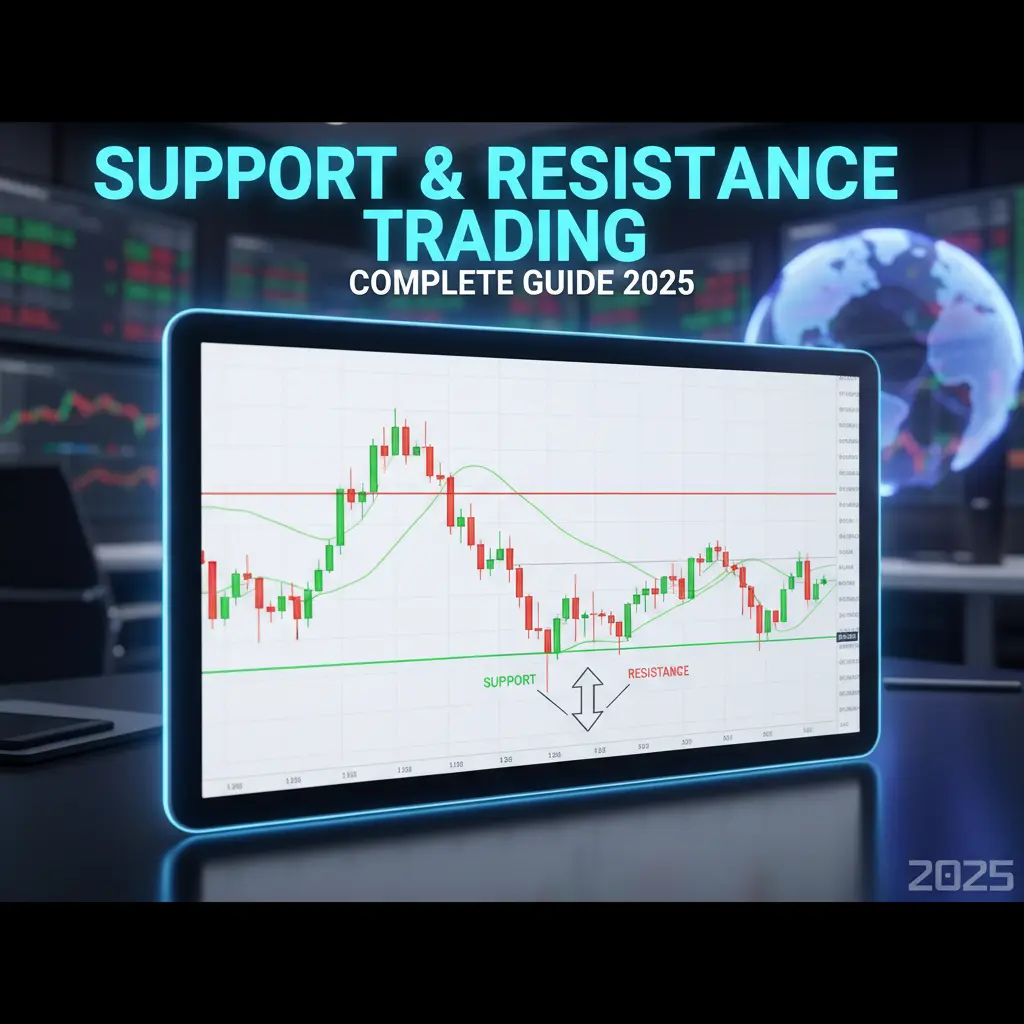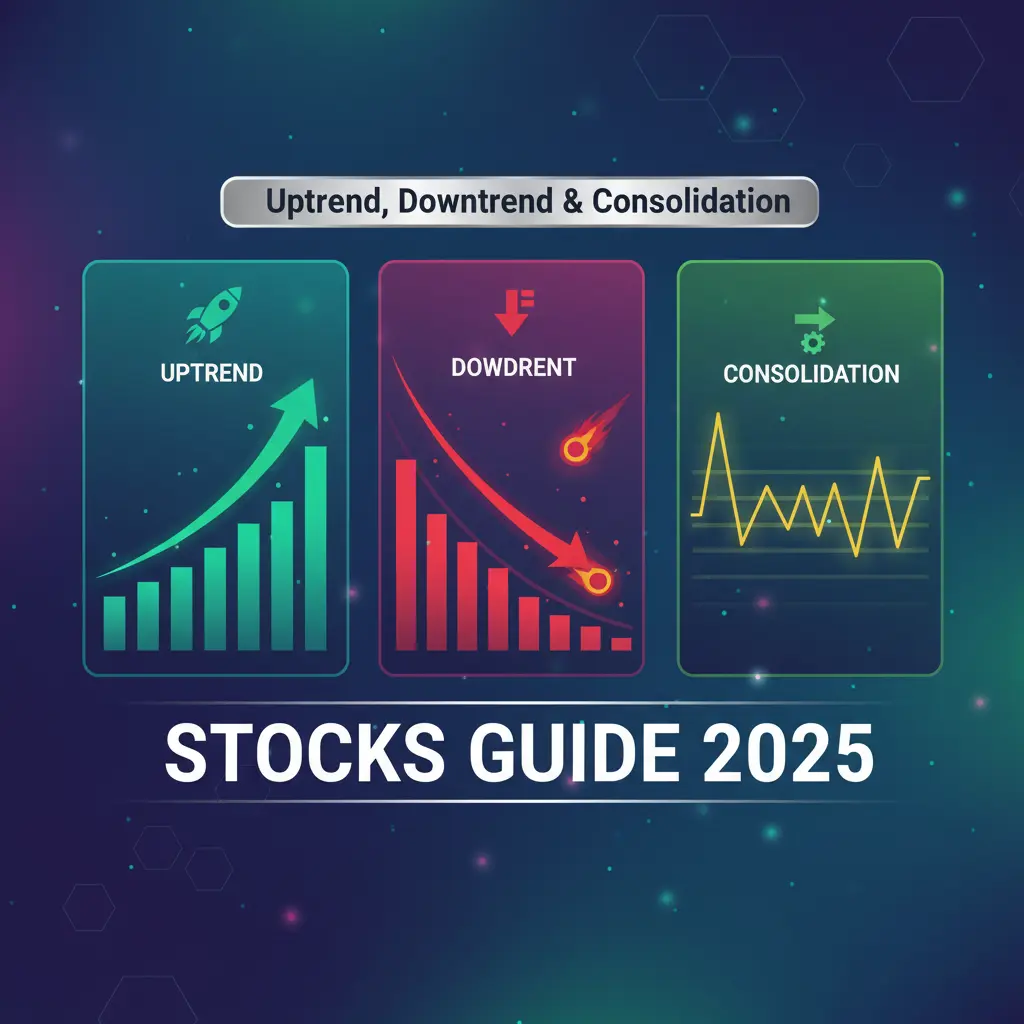
Mastering Stock Market Trends: How to Identify Uptrend, Downtrend & Consolidation
22 Oct 2025
Master the art of technical analysis with comprehensive indicator explanations and interactive examples

Technical indicators are mathematical calculations based on a security's price, volume, or open interest that help traders identify potential trading opportunities. These indicators transform raw market data into actionable insights, helping traders make informed decisions about entry points, exit points, and market direction.
Think of technical indicators as your trading dashboard - just as a car's dashboard shows speed, fuel level, and engine temperature, technical indicators show momentum, trend strength, volatility, and market sentiment. When used correctly, they can significantly improve your trading accuracy and risk management.
Key Insight: No single indicator is perfect. The most successful traders combine multiple indicators to confirm signals and filter out false positives. Always use indicators in conjunction with price action analysis.
Show the direction and strength of market trends. Examples: Moving Averages, MACD, ADX
Measure the speed of price movements. Examples: RSI, Stochastic, CCI
Show how much prices are fluctuating. Examples: Bollinger Bands, ATR
Analyze trading volume to confirm trends. Examples: OBV, Volume Profile
These indicators help identify the direction and strength of market trends, helping traders ride the momentum.
Trend Direction & Support/Resistance
Moving averages smooth out price data to create a single flowing line, making it easier to identify the direction of the trend. The most common types are Simple Moving Average (SMA) and Exponential Moving Average (EMA).
Trend & Momentum Combined
The Moving Average Convergence Divergence (MACD) shows the relationship between two moving averages. It consists of the MACD line, signal line, and histogram, providing both trend and momentum signals.
These indicators measure the speed and strength of price movements, helping identify overbought and oversold conditions.
Overbought/Oversold Levels
RSI measures the speed and change of price movements on a scale of 0 to 100. It helps identify overbought (above 70) and oversold (below 30) conditions, as well as potential trend reversals.
Momentum & Trend Reversals
The Stochastic Oscillator compares a closing price to its price range over a specific period. It consists of two lines (%K and %D) that fluctuate between 0 and 100, indicating momentum and potential reversal points.
These indicators measure the rate of price movements, helping traders understand market uncertainty and potential breakout points.
Volatility & Price Channels
Bollinger Bands consist of a middle band (SMA) and two outer bands that represent standard deviations. The bands expand during high volatility and contract during low volatility, helping identify potential breakouts.
Volatility Measurement
ATR measures market volatility by decomposing the entire range of an asset price for that period. It doesn't provide direction but shows how much an asset typically moves, helping with position sizing and stop-loss placement.
Understanding which indicators work best in different market conditions is crucial for successful trading. Here's a comprehensive comparison:
| Indicator | Best Market Condition | Primary Use | Strengths | Weaknesses | Reliability |
|---|---|---|---|---|---|
| Moving Averages | Trending Markets | Trend Identification | Simple, Reliable in trends | Lagging, Poor in sideways markets | High |
| RSI | Range-bound Markets | Overbought/Oversold | Excellent for reversals | Can stay extreme in trends | Very High |
| MACD | All Market Conditions | Trend & Momentum | Versatile, Multiple signals | Complex for beginners | High |
| Bollinger Bands | Volatile Markets | Volatility & Breakouts | Great for volatility analysis | False breakouts common | Medium-High |
| Stochastic | Range-bound Markets | Momentum & Timing | Excellent entry timing | Whipsaws in trends | Medium |
Use this calculator to determine your optimal position size based on your risk tolerance and the stock's volatility (ATR).
Using multiple indicators together can significantly improve your trading accuracy. Here are proven combinations:
Moving Average + RSI
Use MA for trend direction and RSI for entry timing. Buy when price is above MA and RSI is oversold.
Bollinger Bands + MACD
Use BB for volatility and MACD for trend confirmation. Trade breakouts with MACD confirmation.
RSI + Stochastic
Use both momentum indicators to confirm signals. Reduces false entries in ranging markets.
MA + RSI + Volume
Comprehensive approach: Trend + Momentum + Volume confirmation for high-probability trades.
Golden Rule: Never use more than 3-4 indicators at once. Too many indicators create "analysis paralysis" and conflicting signals. Choose one from each category that fits your trading style.
A condition where the price has risen too far too fast and is likely to experience a pullback.
A condition where the price has fallen too far too fast and is likely to experience a bounce.
When the price moves in opposite direction to an indicator, signaling potential reversal.
When two indicator lines cross each other, often generating buy or sell signals.
An indicator that follows price action (e.g., Moving Averages).
An indicator that attempts to predict future price movements (e.g., RSI).
The rate at which the price of a security increases or decreases.
The rate of acceleration of a security's price or volume.
Technical indicators are powerful tools that, when used correctly, can significantly enhance your trading performance. Remember that indicators are derived from price action - they don't predict the future but rather help you understand current market conditions and probabilities.
The key to successful indicator usage is simplicity and consistency. Find 2-3 indicators that work well with your trading style and master them. Avoid constantly changing your indicator setup, as this leads to confusion and poor decision-making.
Final Wisdom: Technical indicators work best when combined with sound risk management, emotional discipline, and continuous learning. No indicator is perfect, but a well-tested system using multiple confirming indicators can give you a significant edge in the markets.
This is not a recommendation to buy or sell. The information presented in this blog post is for educational and informational purposes only. It should not be construed as investment advice or a recommendation to buy, sell, or hold any security. The stock market is subject to risks, and past performance is not indicative of future results. Readers are strongly advised to conduct their own research and consult with a qualified financial advisor before making any investment decisions.
Do Your Own Research (DYOR): Before making any investment, you must check the latest financial statements, analyze the company's current order book and management commentary, and understand the risks involved.