Top Technical Indicators: Complete Guide 2025
22 Oct 2025
Learn to identify uptrends, downtrends, and consolidation patterns with technical analysis

In the dynamic world of stock market investing, prices are never static. They move in discernible patterns and trends that, once understood, can provide powerful insights into future price direction. Technical analysis is the art of studying these historical price and volume patterns to forecast potential price movements.
While fundamental analysis focuses on a company's intrinsic value through its financial statements, technical analysis concerns itself with what the market is actually doing—the price action and volume data generated by all market participants. This blog post will equip you with the essential tools to identify the three primary market trends and understand the crucial concepts of price and time corrections, helping you make more informed trading and investment decisions.
At its simplest, a trend is the general direction in which a stock's price is moving. These trends are made up of peaks (highs) and troughs (lows), and the direction of these peaks and troughs defines the trend itself.
Characterized by Higher Highs and Higher Lows
An uptrend, often called a "bull market" in its long-term form, is characterized by a consistent pattern of higher highs and higher lows. Imagine a staircase leading upwards: each step reaches a new level (higher high), and each subsequent step back doesn't fall as low as the previous one (higher low).
Characterized by Lower Highs and Lower Lows
A downtrend is the opposite of an uptrend, marked by a series of lower highs and lower lows. Think of it as a descending staircase where each rally fails to reach previous highs, and each decline breaks below previous support levels.
Characterized by Range-Bound Price Action
A sideways trend, also known as consolidation or a ranging market, occurs when the price moves within a relatively horizontal band without making significant higher highs or lower lows. This is a period of indecision where the forces of supply and demand are roughly in balance.
Not all market pauses are created equal. After a strong price move, a stock often undergoes a correction, which can happen in two distinct ways.
Key Insight: Understanding the difference between price and time corrections helps investors maintain perspective during market pauses and avoid emotional decision-making.
| Feature | Price Correction | Time Correction |
|---|---|---|
| Definition | Visible decline in stock price (typically 10-20%) | Extended period of sideways price movement |
| Duration | Relatively short (days to weeks) | Extended (weeks to months or years) |
| Market Impact | Immediate portfolio value decrease | Opportunity cost and inflation erosion |
| Investor Psychology | Triggers fear and panic selling | Tests patience and conviction |
| Example | COVID-19 market crash (March 2020) | Nifty consolidation (Jan-Mar 2023) |
To systematically identify a trend, combine the tools discussed above into a single framework.
Start with a top-down approach. First, check the trend of the major market index (like Nifty 50 or Sensex), then the sectoral index, and finally the individual stock. Trading with the broader market trend increases your odds of success.
Connect the significant highs and lows on the chart. Is the line sloping up, down, or flat? This is your first visual clue. For uptrends, connect higher lows; for downtrends, connect lower highs.
Check the position of the stock relative to its key moving averages and the alignment between the moving averages themselves. A "Golden Cross" (50-day MA crossing above 200-day MA) is bullish, while a "Death Cross" is bearish.
Use an oscillator like the Relative Strength Index (RSI) or MACD to understand the trend's strength. For example, an RSI reading above 50 often supports a bullish trend, while a reading below 50 can support a bearish one.
Always check if volume confirms the price movement. A breakout from a pattern or trend line should be accompanied by high volume to be considered valid. Low volume breakouts are often false signals.
When the price moves decisively above a resistance level (breakout) or below a support level (breakdown), often signaling the start of a new trend.
A period where the price moves sideways within a defined range, indicating market indecision and balance between buyers and sellers.
A technical indicator that smooths out price data by creating a constantly updated average price, helping to identify the direction of the trend.
A momentum oscillator that measures the speed and change of price movements on a scale of 0 to 100, used to identify overbought and oversold conditions.
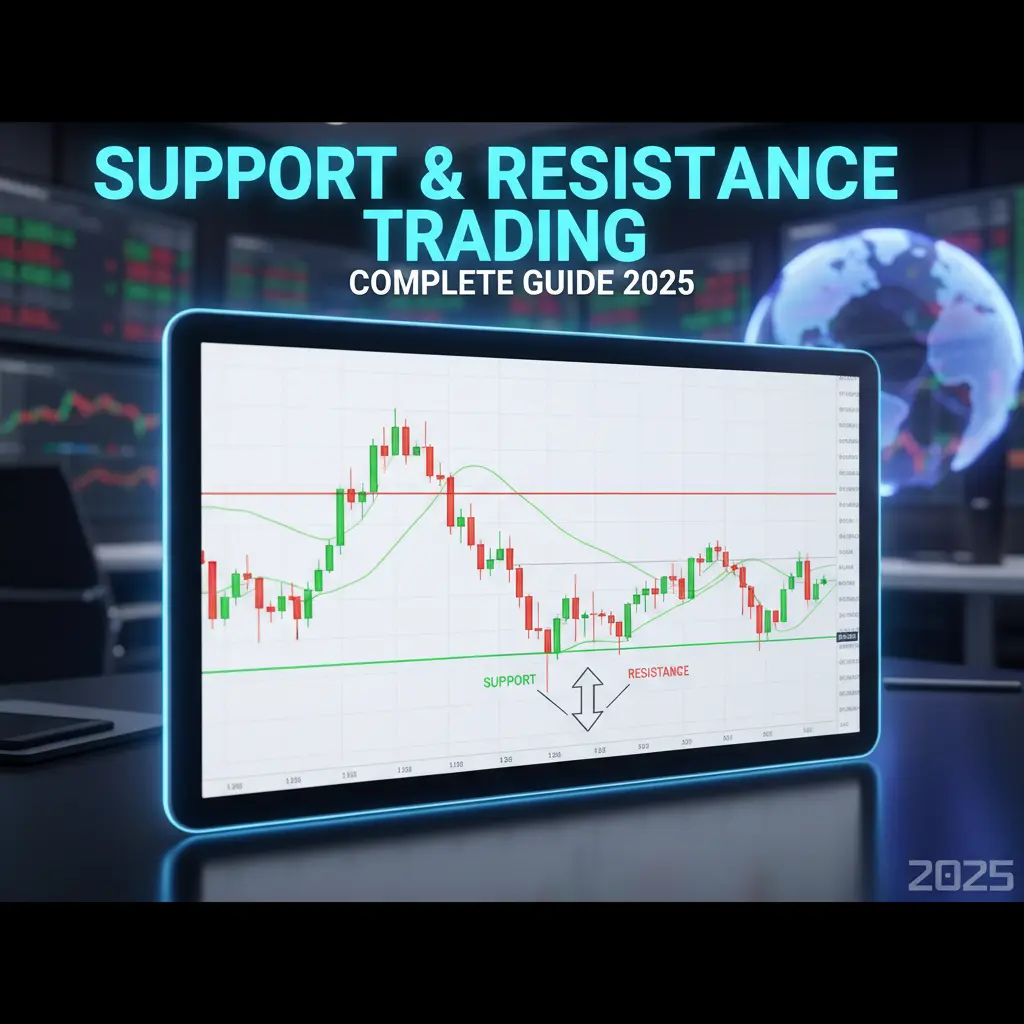
Key price levels on a chart. Support is where buying interest emerges, while resistance is where selling pressure increases.
A method of evaluating securities by analyzing statistics generated by market activity, such as historical price and volume.
The number of shares or contracts traded in a security or market during a given period, used to confirm the strength of a price trend.
Golden Cross occurs when a short-term MA crosses above a long-term MA (bullish). Death Cross is the opposite (bearish).
Learning to identify market trends and corrections is a foundational skill for any trader or investor. Remember that no single indicator should be used in isolation. The most reliable signals occur when multiple tools—trend lines, moving averages, volume, and momentum oscillators—all point in the same direction.
Furthermore, understanding whether a stock is undergoing a price correction or a time correction will help you manage your expectations and investment strategy effectively. A price correction offers a visible entry opportunity, while a time correction tests an investor's patience and highlights the importance of opportunity cost.
Pro Tip: Combine technical analysis with fundamental analysis for the most comprehensive view. While technicals tell you "when" to buy, fundamentals tell you "what" to buy.
This is not a recommendation to buy or sell. The information presented in this blog post is for educational and informational purposes only. It should not be construed as investment advice or a recommendation to buy, sell, or hold any security. The stock market is subject to risks, and past performance is not indicative of future results. Readers are strongly advised to conduct their own research and consult with a qualified financial advisor before making any investment decisions.
Do Your Own Research (DYOR): Before making any investment, you must check the latest financial statements, analyze the company's current order book and management commentary, and understand the risks involved.