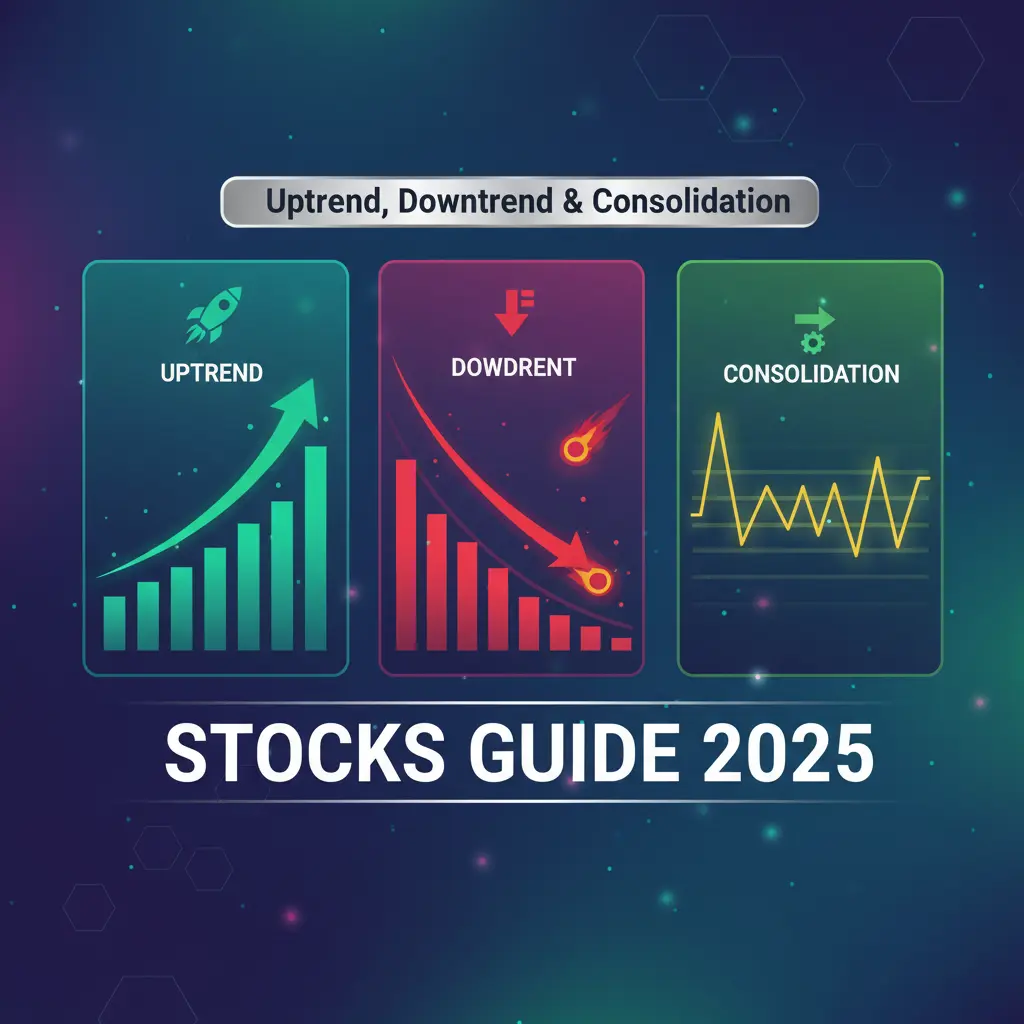
Mastering Stock Market Trends: How to Identify Uptrend, Downtrend & Consolidation
22 Oct 2025
Master the foundation of technical analysis with comprehensive support and resistance strategies

Support and resistance are the fundamental concepts that form the bedrock of technical analysis. Think of them as the "floor" and "ceiling" of price movements - psychological barriers where buyers and sellers battle for control. Understanding these levels is crucial because they represent areas where market sentiment often shifts dramatically.
Whether you're a day trader, swing trader, or long-term investor, mastering support and resistance can significantly improve your entry and exit timing, risk management, and overall trading performance. These levels work because they're based on human psychology and the collective memory of market participants.
Key Insight: Support and resistance levels become more significant with each successful test. The more times price respects a level, the stronger that level becomes in traders' minds.
Traders remember previous price levels where buying or selling occurred, creating collective memory zones.
As more traders watch the same levels, their collective actions make these levels significant.
Support represents demand (buyers), resistance represents supply (sellers).
Clear levels provide natural places for stop losses and profit targets.
Understanding the fundamental principles of support and resistance is essential for effective trading.
The Price Floor
Support is a price level where buying interest is sufficiently strong to overcome selling pressure. As the price approaches support, buyers become more inclined to buy and sellers become less inclined to sell.
The Price Ceiling
Resistance is a price level where selling pressure overcomes buying pressure, causing the price to stop rising. As the price approaches resistance, sellers become more inclined to sell and buyers become less inclined to buy.
One of the most powerful concepts in technical analysis is that once a support level is broken, it often becomes resistance. Similarly, when resistance is broken, it often becomes support. This phenomenon occurs due to shifts in market psychology.
Trading Wisdom: A broken support level that turns into resistance (or vice versa) is often more reliable than the original level because it represents a psychological shift in market sentiment.
Those who didn't sell at resistance now get a second chance when it becomes support.
When broken resistance becomes support, it confirms the breakout was genuine.
Market makers often push prices to these levels to trigger stop losses.
New traders see these levels as opportunities to enter in the direction of the trend.
Beyond basic horizontal levels, these advanced concepts provide deeper trading insights.
When Levels Fail
Breakouts occur when price moves above resistance, while breakdowns happen when price moves below support. These events signal potential trend changes and often lead to significant price movements.
The Human Element
Support and resistance work because they reflect human psychology - fear, greed, hope, and regret. Understanding the psychological dynamics at these levels can give you an edge in predicting price movements.
Finding accurate support and resistance levels is both an art and a science. Here's a systematic approach to identify the most significant levels on any chart.
| Level Type | How to Identify | Strength Factors | Reliability | Trading Approach |
|---|---|---|---|---|
| Horizontal Levels | Previous swing highs/lows | Number of touches, Time frame | Very High | Bounce trades, Breakouts |
| Trend Lines | Connect higher lows (uptrend) or lower highs (downtrend) | Angle, Duration, Number of touches | High | Trend following, Reversals |
| Moving Averages | Dynamic levels that change with price | Period length, Slope | Medium-High | Trend confirmation, Bounces |
| Fibonacci Levels | 38.2%, 50%, 61.8% retracements | Clear impulse wave, Time frame | Medium | Retracement entries, Targets |
| Pivot Points | Calculated from previous day's H/L/C | Market consensus, Volume | Medium | Intraday trading, Range bounds |
Calculate your optimal position size when trading support and resistance levels with proper risk management.
Different market conditions call for different approaches. Here are proven strategies for trading support and resistance levels.
Buy at support, sell at resistance
Classic range-bound strategy. Enter long near support with stop below, target resistance.
Trade the break of key levels
Enter when price breaks through resistance (or support) with high volume confirmation.
Trade the reversal after failed breaks
When price breaks a level but quickly reverses, fade the move in the opposite direction.
Trade the retest of broken levels
When broken support becomes resistance (or vice versa), trade the first retest.
Pro Tip: Always wait for confirmation before entering trades. A bounce isn't confirmed until price actually reverses, and a breakout isn't confirmed until price closes beyond the level with conviction.
A price level where buying interest is strong enough to overcome selling pressure, preventing further decline.
A price level where selling pressure overcomes buying pressure, preventing further advance.
When price moves above a resistance level, often signaling the start of a new uptrend.
When price moves below a support level, often signaling the start of a new downtrend.
The phenomenon where broken support becomes resistance, or broken resistance becomes support.
A period where price moves sideways between support and resistance, indicating market indecision.
When price returns to a previously broken level to test it from the other side.
When price briefly moves beyond a level but quickly reverses, trapping breakout traders.
Support and resistance represent the fundamental building blocks of technical analysis. While they may seem simple conceptually, mastering their application requires practice, patience, and psychological discipline. The most successful traders aren't those who know the most complex indicators, but those who have mastered these basic concepts.
Remember that context is everything. A support level in an uptrend is much more reliable than the same level in a downtrend. Always consider the broader market context, time frame, and volume confirmation before trading these levels.
Final Wisdom: The markets are a reflection of human psychology, and support/resistance levels are where this psychology becomes visible. Learn to read these levels, understand the story they tell, and you'll have a significant edge in your trading journey.
This is not a recommendation to buy or sell. The information presented in this blog post is for educational and informational purposes only. It should not be construed as investment advice or a recommendation to buy, sell, or hold any security. The stock market is subject to risks, and past performance is not indicative of future results. Readers are strongly advised to conduct their own research and consult with a qualified financial advisor before making any investment decisions.
Do Your Own Research (DYOR): Before making any investment, you must check the latest financial statements, analyze the company's current order book and management commentary, and understand the risks involved.