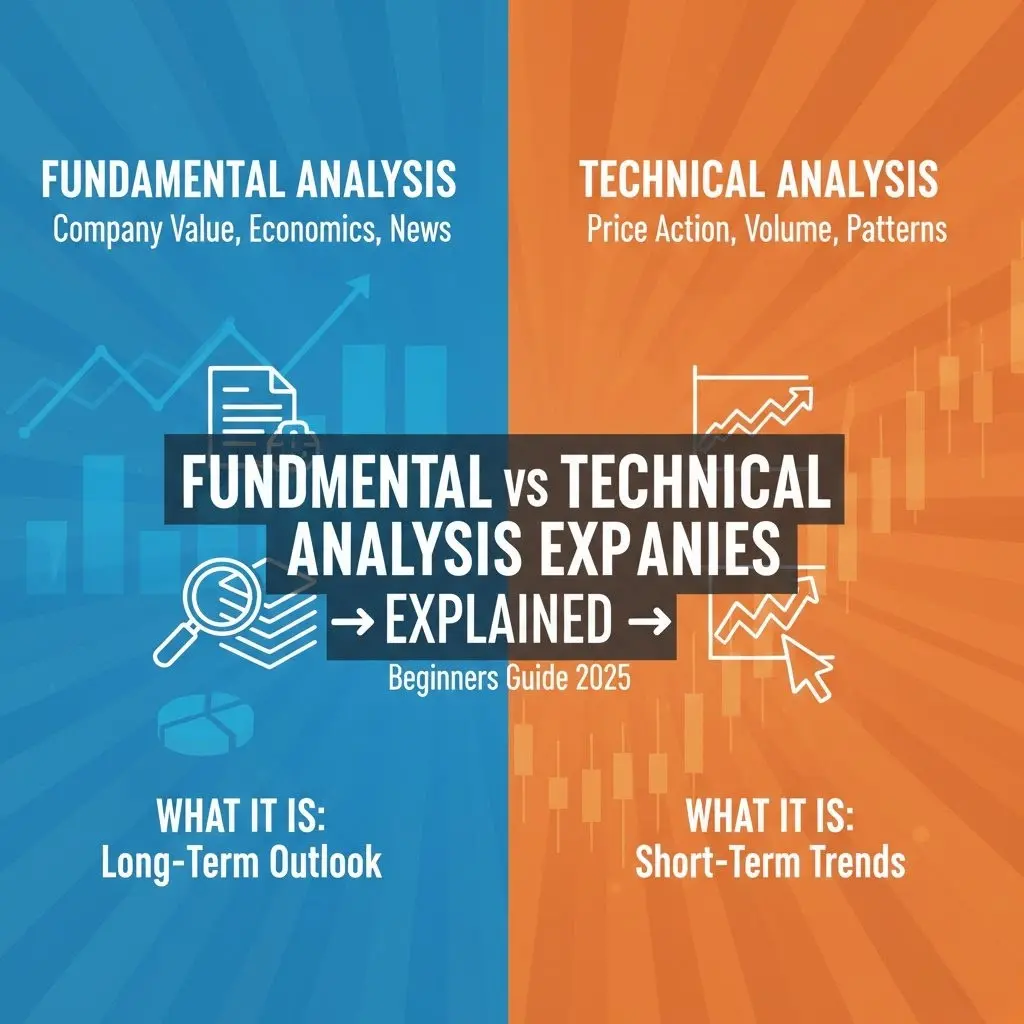

Introduction to Stock Analysis Methods
When it comes to stock market investing, two primary schools of thought dominate the landscape: fundamental analysis and technical analysis. Both approaches aim to help investors make better decisions, but they use completely different methodologies and time horizons. Understanding the difference between these two methods is crucial for any investor looking to develop a successful investment strategy.
💡 Warren Buffett on Analysis
"Price is what you pay. Value is what you get." - Warren Buffett, emphasizing the fundamental analysis approach
Quick Overview: Fundamental vs Technical Analysis
| Aspect | Fundamental Analysis | Technical Analysis |
|---|---|---|
| Primary Focus | Company's intrinsic value | Price movements and patterns |
| Time Horizon | Long-term (years) | Short-term (days to months) |
| Data Used | Financial statements, economic data | Price charts, volume, indicators |
| Main Goal | Find undervalued stocks | Predict price direction |
| Key Assumption | Market misprices stocks temporarily | Price reflects all available information |
Fundamental Analysis: The Value Investor's Approach
What is Fundamental Analysis?
Fundamental analysis is a method of evaluating a stock by examining the underlying company's financial health, business model, industry position, and economic factors. The goal is to determine the intrinsic value of a company and compare it with the current market price to identify investment opportunities.
💡 Core Principle
Fundamental analysts believe that stock markets may misprice securities in the short run, but eventually, the true intrinsic value will be reflected in the stock price. This creates opportunities to buy undervalued stocks or sell overvalued ones.
Key Components of Fundamental Analysis:
💰 Financial Statement Analysis
Examining balance sheets, income statements, and cash flow statements to assess company health
🏢 Business Model Analysis
Understanding how the company makes money and its competitive advantages
🌍 Industry Analysis
Evaluating the company's position within its industry and growth prospects
📈 Economic Analysis
Considering macroeconomic factors that could impact the company's performance
Fundamental Analysis Tools and Ratios
| Ratio Type | Formula | What It Measures | Ideal Range |
|---|---|---|---|
| P/E Ratio | Price / EPS | Valuation relative to earnings | Industry dependent |
| P/B Ratio | Price / Book Value | Market value vs accounting value | < 1.5 (value) |
| Debt-to-Equity | Total Debt / Equity | Financial leverage | < 1.0 (conservative) |
| ROE | Net Income / Equity | Profitability efficiency | > 15% |
| Current Ratio | Current Assets / Liabilities | Short-term liquidity | > 1.5 |
Technical Analysis: The Chartist's Approach
What is Technical Analysis?
Technical analysis is a methodology that forecasts the direction of prices through the study of past market data, primarily price and volume. Technical analysts believe that historical trading activity and price changes can predict future price movements.
💡 Core Principle
Technical analysis operates on three main assumptions: 1) The market discounts everything, 2) Price moves in trends, and 3) History tends to repeat itself. This means all known information is already reflected in the price, and patterns tend to recur.
Key Components of Technical Analysis:
📊 Chart Patterns
Head and shoulders, double tops/bottoms, triangles, flags, and other formations
📏 Technical Indicators
Moving averages, RSI, MACD, Bollinger Bands, and oscillators
📉 Support & Resistance
Price levels where buying or selling pressure emerges consistently
📊 Volume Analysis
Trading volume patterns that confirm or contradict price movements
Popular Technical Analysis Tools
| Indicator | Purpose | How to Use | Common Settings |
|---|---|---|---|
| Moving Averages | Identify trend direction | Price above MA = uptrend, below = downtrend | 50-day, 200-day |
| RSI | Measure overbought/oversold | >70 = overbought, <30 = oversold | 14 periods |
| MACD | Trend changes and momentum | Line crossovers signal buy/sell | 12,26,9 |
| Bollinger Bands | Volatility and price levels | Price near bands = extreme move possible | 20 periods, 2 std dev |
| Volume | Confirm price movements | High volume confirms trend strength | Compare to average |
Key Differences: Side-by-Side Comparison
Fundamental vs Technical Analysis: Detailed Comparison
| Parameter | Fundamental Analysis | Technical Analysis |
|---|---|---|
| Philosophy | Buy undervalued companies for long-term growth | Trade price movements regardless of company value |
| Time Horizon | Long-term (1+ years) | Short-term (minutes to months) |
| Data Used | Financial statements, economic reports, industry data | Price charts, volume, technical indicators |
| Decision Basis | Intrinsic value calculation | Chart patterns and indicators |
| Success Factors | Company performance, industry growth | Market psychology, trend identification |
| Risk Level | Lower (long-term focus) | Higher (short-term volatility) |
| Skill Required | Accounting, finance, business analysis | Chart reading, pattern recognition |
| Famous Proponents | Warren Buffett, Benjamin Graham | John Murphy, Martin Pring |
Which Approach Should You Use?
Choosing the Right Analysis Method
Common Myths and Misconceptions
Debunking Analysis Myths
Reality: Growth investors also use fundamental analysis to identify companies with strong growth potential
Reality: While not perfect, technical analysis uses statistical patterns and has proven effective for many traders
Reality: Many successful investors use both methods for different purposes in their strategy
Reality: Volatility often creates the best opportunities for fundamental investors to buy quality stocks at discounted prices
Getting Started: Beginner's Action Plan
Your Step-by-Step Guide
Final Thought: Both fundamental and technical analysis have their merits and limitations. The best approach depends on your personality, goals, and time commitment. Many successful investors use a combination - fundamental analysis for stock selection and technical analysis for timing their investments. Remember that no method guarantees success, and continuous learning combined with disciplined execution is key to long-term investing success.
Other Financial Articles


Top 10 Financial Ratios Every Investor Should Know

How to Identify Undervalued Stocks in India
