
Q2 FY26 Infrastructure & Engineering Sector Overview
Larsen & Toubro, India's premier engineering and construction conglomerate, has delivered another strong quarterly performance, underscoring its leadership position in the infrastructure sector. The Q2 FY26 results reflect the company's execution excellence, diversified business model, and ability to capitalize on India's infrastructure growth story. With consistent growth across segments and strong order book visibility, L&T continues to be a bellwether for the Indian economy's infrastructure development.
About the Company
Larsen & Toubro Limited is India's leading engineering and construction conglomerate with a diversified presence across infrastructure, hydrocarbon, power, defense, and IT services. The company operates through multiple segments including Infrastructure Projects, Energy Projects, Hi-Tech Manufacturing, IT & Technology Services, and Financial Services. With a rich legacy spanning over eight decades, L&T has established itself as a trusted partner for India's infrastructure development, executing some of the most complex projects in the country and internationally. The company's strong project execution capabilities, technological expertise, and financial discipline make it a preferred choice for both public and private sector projects.
Key Financial Metrics & Technical Parameters
Quarterly Performance Highlights (YoY Comparison)
| Financial Parameter | Q2 FY26 | Q1 FY26 | Q2 FY25 | Analysis |
|---|---|---|---|---|
| Revenue from Operations | ₹ 67,984 Cr | ₹ 63,679 Cr | ₹ 61,555 Cr | Consistent growth trajectory |
| Net Profit | ₹ 4,678 Cr | ₹ 4,318 Cr | ₹ 4,099 Cr | Strong profitability improvement |
| Total Income | ₹ 69,368 Cr | ₹ 66,936 Cr | ₹ 62,656 Cr | Broad-based growth |
| EPS | ₹ 28.54 | ₹ 26.30 | ₹ 24.69 | Improving shareholder returns |
Segment-wise Performance Analysis
| Business Segment | Q2 FY26 Revenue (₹ Cr) | Growth Drivers | Outlook |
|---|---|---|---|
| Infrastructure Projects | 32,149 | Government spending, urban development | Positive with strong order book |
| Energy Projects | 13,000 | Oil & gas, renewable energy projects | Stable with international expansion |
| Hi-Tech Manufacturing | 23,040 | Defense, aerospace, nuclear equipment | Strong with 'Make in India' push |
| IT & Technology Services | 13,854 | Digital transformation, cloud services | Robust growth continuing |
💡 Investment Perspective
- Premium Valuation: P/E of 33.9 reflects growth expectations and market leadership
- Strong Fundamentals: Consistent revenue and profit growth across cycles
- Diversified Business: Multiple growth drivers reducing business risk
- Government Partnership: Key player in India's infrastructure development
- International Presence: Reducing dependence on domestic market
- Order Book Strength: Robust pipeline ensuring future revenue visibility
Financial Health & Ratio Analysis
| Financial Ratio | Current | Previous Quarter | Year Ago | Analysis |
|---|---|---|---|---|
| Debt Equity Ratio | 1.09 | 1.13 | 1.17 | Improving trend, manageable |
| Interest Coverage Ratio | 7.96 | 7.15 | 6.11 | Strong debt servicing capability |
| Current Ratio | 1.25 | 1.21 | 1.17 | Healthy liquidity position |
| Operating Margin | 10.01% | 9.92% | 10.34% | Stable margin performance |
| Net Profit Margin | 6.88% | 6.78% | 6.66% | Improving profitability |
Balance Sheet Strength: L&T maintains a strong balance sheet with total assets of ₹3,91,103 Cr and equity of ₹1,19,807 Cr. The company's financial discipline and robust cash flows provide stability during economic cycles. The improving debt-equity ratio and strong interest coverage reflect prudent financial management.
⚠️ Key Challenges & Monitorables
- Execution Risks: Large infrastructure projects face execution delays and cost overruns
- Margin Pressure: Competitive bidding in infrastructure projects could impact margins
- Global Uncertainty: International operations exposed to geopolitical risks
- Regulatory Changes: Policy changes affecting infrastructure spending
- Commodity Prices: Fluctuations in raw material costs impacting project economics
- Working Capital: Large working capital requirements for infrastructure projects
💡 Growth Drivers & Positive Developments
- Government Initiatives: Strong pipeline from National Infrastructure Pipeline
- Private Capex Revival: Increasing private sector investment in capacity expansion
- International Expansion: Growing presence in Middle East and African markets
- Digital Transformation: L&T Technology Services showing robust growth
- Clean Energy Focus: Positioned well in renewable energy and green hydrogen
- Defense Manufacturing: Benefitting from 'Make in India' in defense sector
Investment Outlook & Market Position
Long-term Growth Prospects & Valuation
| Parameter | L&T Position | Industry Position | Analysis |
|---|---|---|---|
| Market Leadership | Dominant Player | Fragmented | Strong competitive advantage |
| Order Book Visibility | Strong (2-3 years) | Moderate | Revenue visibility provides stability |
| International Revenue | ~25-30% | Varies | Diversified revenue base |
| Technology Integration | High | Moderate | Digital capabilities provide edge |
| Valuation Premium | Premium (P/E 33.9) | 15-25 P/E | Justified by growth and quality |
Investment Perspective: Larsen & Toubro presents a compelling case for long-term investors seeking exposure to India's infrastructure growth story. While the current valuation at P/E of 33.9 demands premium, it is justified by the company's market leadership, strong execution capabilities, and diversified business model. The consistent performance across business segments and robust order book provide visibility for future growth. However, investors should be mindful of execution risks and monitor margin trends closely.
⚠️ Sector-Wide Challenges & Opportunities
Infrastructure Spending: Government focus on infrastructure provides strong tailwinds but execution remains key
Global Competition: Increasing international competition in infrastructure projects
Technology Disruption: Need to adapt to new construction technologies and digital solutions
Sustainability Focus: Growing emphasis on green infrastructure and sustainable practices
Skill Development: Requirement for skilled workforce in complex infrastructure projects
Regulatory Environment: Evolving regulatory framework for infrastructure development
Other Financial Articles


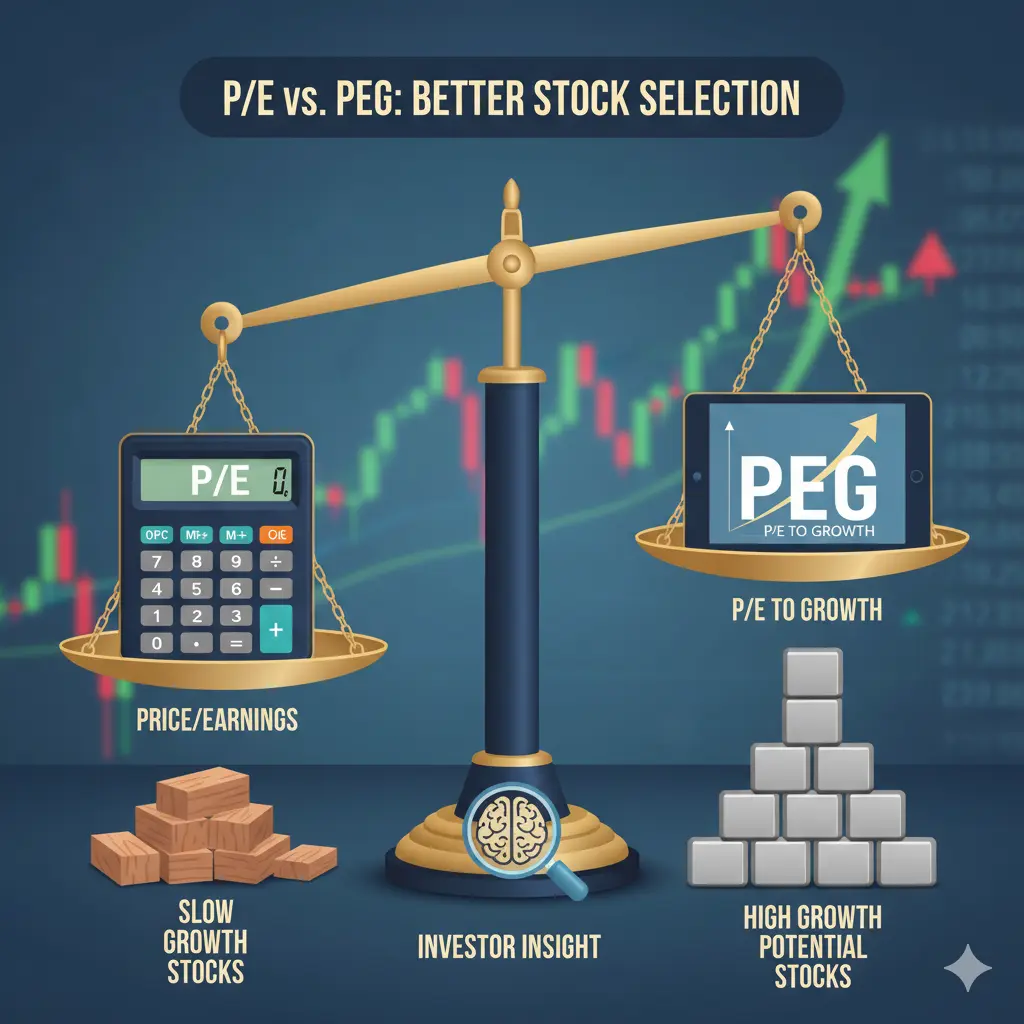
PE vs PEG Ratio: Which is Better for Stock Selection?

🏢 Official Results Reference
For detailed Q2 FY26 results and corporate announcements, refer to the official investor relations:
Larsen & Toubro Q2 FY26 Results - Official PDF